

About
The graphs on this page may be unclear on a PC. This appears to be the result of the image shrinking I've done in order to fit two images side-by-side. In Firefox on a Mac, this page will look fine. If you are not using that browser and would like to see a more legible version of the image, try right-clicking on the image and selecting "View Image." On Firefox, that gives you the original full-sized image. Buttons for access to the archives that generate the graphs below is available here (scroll down to the middle of the page).
Data frequency: Sub-hour archive records prior to 21 August 2009 are provided in 5-minute intervals. Beginning with 21 August 2009, sub-hour archive records are provided at 30-minute intervals.
Text and image presentations of data: You may see a mismatch between text and image presentations of the data (where both are available). If so, this is probably because your browser is using a cached version of the images. Pressing refresh should fix the problem.
Cumulative reports and archives: Because of some incorrect data (described below), cumulative values in both the reports and archives may be incorrect. This includes:
- Reports for 2009: There is no data prior to August, due to problems with the data processing server.
- Reports for 2012 and 2013: There is no data from approximately October 2012 to February 2013, due to problems with the data processing server.
Bad data:
While the list below is
Station changes that affect the archives:
The first station operated until 14 June 2012. A replacement station
was installed 14 June 2012. All yearly cumulative data for 2012 are
incorrect because of the station change and the purge of a few months
of 2012 data from the first station.
Both the first and second stations are the same make and model.
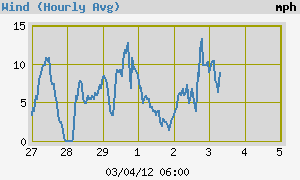
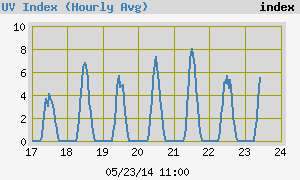
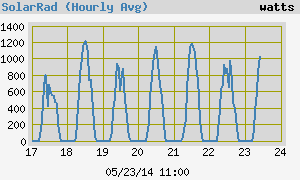
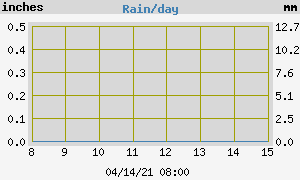
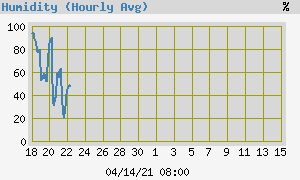
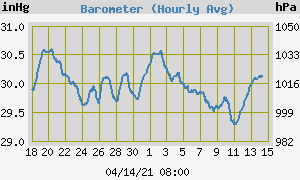
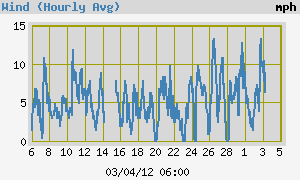
Past Week
|
|
|
|
|
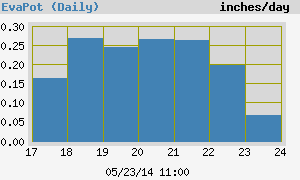
Past Month
|
|
|
|
|
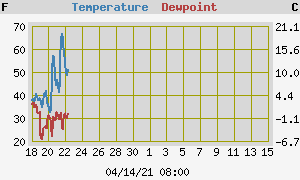
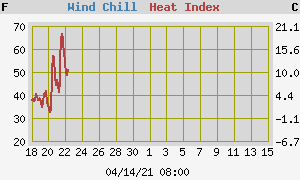
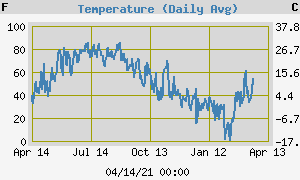
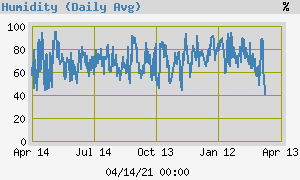
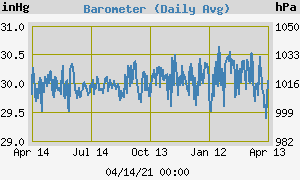
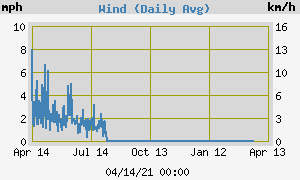
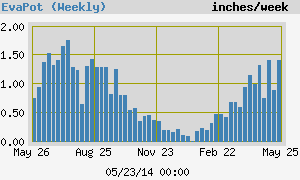
Past Year
|
|
|
|
|